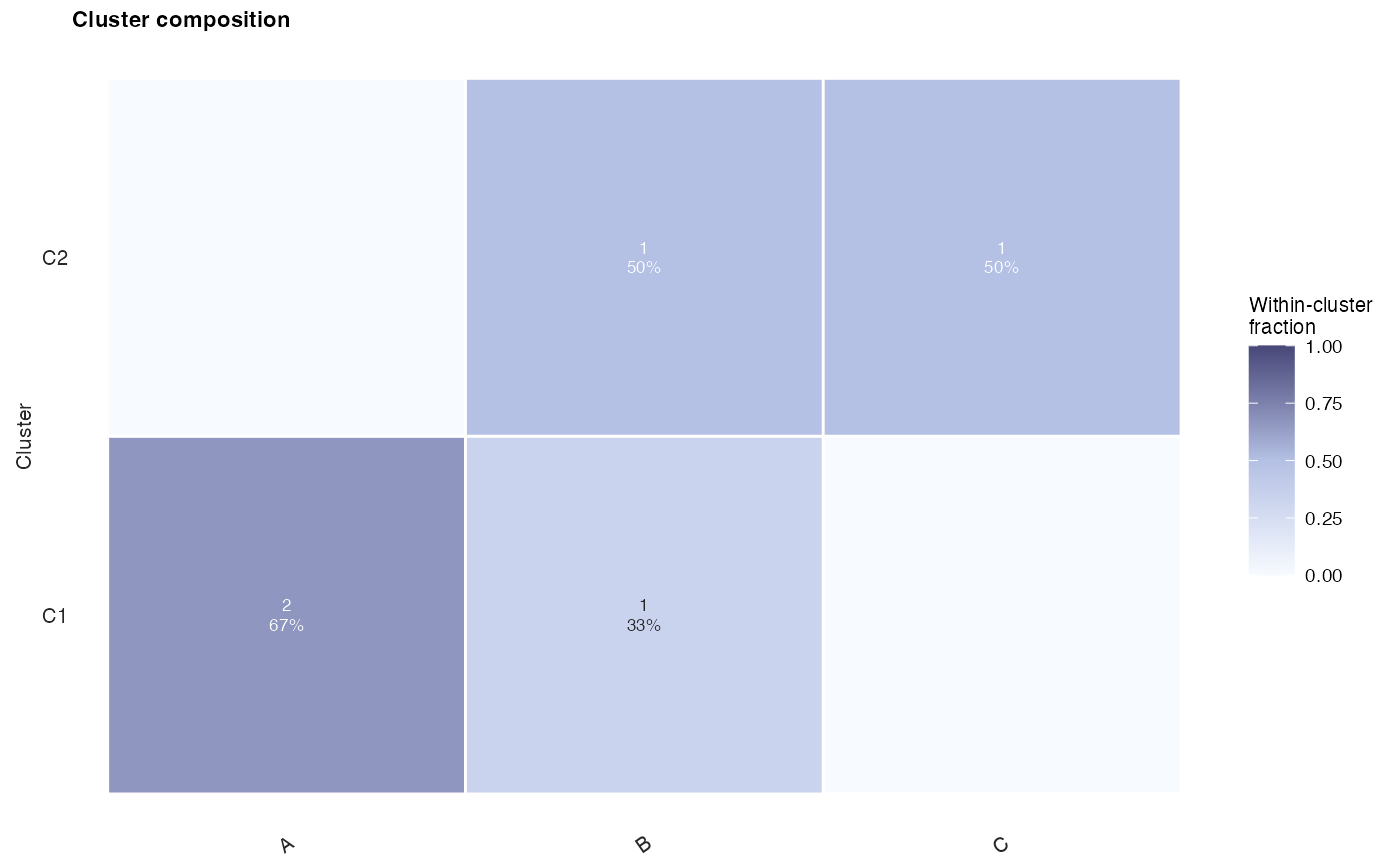
Plot cluster composition as a heatmap
Source:R/plot_cluster_composition.R
plot_cluster_composition.RdBuild a composition heatmap from paired cluster labels and an external annotation. The default shows the distribution of annotation classes within each cluster. Sample labels are paired by position; align them by sample identifier before calling this function when necessary.
Usage
plot_cluster_composition(
  cluster,
  annotation,
  normalize = c("cluster", "annotation", "total", "none"),
  label = c("count_percent", "count", "percent", "none"),
  na.rm = TRUE,
  drop = TRUE,
  percent_digits = 0L,
  main = "Cluster composition",
  xlab = NULL,
  ylab = "Cluster",
  colours = c("#F7FBFF", "#B4C0E4", "#484878"),
  base_size = 8,
  base_family = "sans"
)
Arguments
- cluster
Cluster labels. A factor preserves its declared level order; other atomic vectors use first-occurrence order.
- annotation
Annotation or reference labels paired positionally with
cluster. Factor levels control the displayed column order.- normalize
Normalization direction.
"cluster"gives row fractions,"annotation"gives column fractions,"total"gives fractions of all retained samples, and"none"displays raw counts.- label
Cell-label style: sample count and percentage, count only, percentage only, or no label. Percentage labels are unavailable when
normalize = "none".- na.rm
Logical; if
TRUE, remove pairs with a missing cluster or annotation. IfFALSE, missing values produce an error.- drop
Logical; whether to drop unused factor levels. With
drop = FALSE, zero-count combinations remain visible.- percent_digits
Integer from 0 to 6 giving the number of decimal places used in percentage labels.
- main, xlab, ylab
Plot title and axis labels. Use
NULLto suppress a label.- colours
Character vector of at least two colours defining the sequential fill gradient.
- base_size
Base font size.
- base_family
Font family.